UPDATE ......From Tuesday 8 April 2025 we have changed the way that Single Sign-on works on this wiki. Please see here for more information:
Update
Requirement
|
|

Overview
In Greek mythology, Prometheus is a Titan that is credited mankind creation by stealing Fire from Gods and by giving it to human. In the RARE context, Prometheus is a the software from prometheus.io project. It became very popular in the IT industry as it is very simple to implement/configure while providing a great number of metrics without impacting application performance. It is heavily used in microservices environment such as docker and Kubernetes. The mythological reference gives us an indication of how Prometheus is operating. At a constant rate, Prometheus metric collector or server is stealing metrics from Prometheus agent. All the stolen metrics are then consolidated in Time Series database ready to be poured to a queueing system for proper visualization.
Before going further, allow me a brief digression by sharing with you a small anecdote that leds to this ongoing work related to network monitoring for RARE. As mentioned previously, our focus is to elaborate RARE/freeRouter solution the possibility to be monitored in an operational environment. In that context, we started with the implementation of a lightweight SNMP stack that provided relevant result via SNMP tools like LibreNMS. This is great for organisation that wouldn’t want invest time on anything but SNMP.
However, we felt a lack of flexibility due to SNMP inherent structure and we needed more versatile and instant monitoring capabilities. More importantly the need to export infinite metric type from Control Plane in a more flexible way arise. How metrics such as: Number of IPv4/IPv6 routes, IPv4 BGP prefix, IPv6 BGP prefix platform JVM memory etc. could be shared without too much hassle ?
After some internal discussion, I just said: "I’m not a monitoring expert but we have tools like ELK and PROMETHEUS and GRAFANA in NMaaS catalog … Shouldn’t we consider use this ?"
The answer was: « Let’s give it a try and fire up a Prometheus and Grafana instance from NMaaS platform !»
Some hacking at the control plane code level were initiated, after few hours freeRouter lead developer came up with a solution and said: Let me introduce you "freeRouter prometheus agent »
And thanks to the great support of NMaaS team, in few minutes and some point and clicks (it took longer than expected as I’m not good with GUI) we were able to test this agent.
Why is it important you might say ? It is just that with prometheus simplicity and low resource overhead with have full control plane metrics visibility !
As a side note this is not a replacement for INT/Telemetry/Netflow/IPFIX that provide different type of data that are to at the same scale…
People with INT/TELEMETRY/NETFLOW/IPFIX are talking about a "data lake" or "data deluge". Which is correct, if you think about the complexity of resolving a gigantic producer/consumer data problem. This needs the relevant IT infrastructure in order to process all of the data provided by these protocol at the NREN scale.
While in our case, we are just focusing on exposing CONTROL PLANE METRICS at the network element level. We simply monitor and ensure a router operation by using prometheus metrics
Note
While he above might be true, the number of metrics exported from a prometheus target can be very high. Fine tuning might be necessary in order to make sure that all metrics are really necessary for network monitoring purpose. This explosion of metrics exposure can add unnecessary workload at the control plane level.
Again, kudos to NMaaS team that made this happen so that we could test this on the P4 LAB with — ZERO — effort.
Article objective
In this article, we will present freeRouter and Prometheus integration and as an example we will implement one of the 22 grafana dashboard that we developed and published here. In the rest of the article we will assume that you are a running one or more freeRouter nodes.
Diagram

[ #001 ] - Cookbook
In this example let's focus our interest interface metrics. Please note that this configuration should be deployed on each freeRouter and connectivity should be available between all targets and the prometheus server.
The objective is to tell freeRouter control plane to expose hardware and software counter interface metric. In order to do this just copy/paste the stanza here below via freeRouter CLI:
prometheus interface metric configuration
!
server prometheus <PROMETHEUS_SERVER_NAME>
 metric inthw command sho inter hwsumm
 metric inthw prepend iface_hw_byte_
 metric inthw name 0 ifc=
 metric inthw replace \. _
 metric inthw column 1 name st
 metric inthw column 1 replace admin -1
 metric inthw column 1 replace down 0
 metric inthw column 1 replace up 1
 metric inthw column 2 name tx
 metric inthw column 3 name rx
 metric inthw column 4 name dr

 metric intsw command sho inter summ
 metric intsw prepend iface_sw_byte_
 metric intsw name 0 ifc=
 metric intsw replace \. _
 metric intsw column 1 name st
 metric intsw column 1 replace admin -1
 metric intsw column 1 replace down 0
 metric intsw column 1 replace up 1
 metric intsw column 2 name tx
 metric intsw column 3 name rx
 metric intsw column 4 name dr
 vrf <VRF_NAME>
 exit
!
So this basically means:
- From freeRouter CLI, issue the following command:
prometheus interface metric configuration
sho inter hwsumm
interface   state  tx          rx          drop
hairpin41   up     67404       0           0
hairpin42   up     153134      0           0
sdn1        up     412319805   1057514903  1152305
sdn2        up     1038840147  407307558   202
sdn3        admin  0           0           0
sdn4        admin  0           0           0
sdn5        admin  0           0           0
sdn6        admin  0           0           0
sdn998      up     9154        0           0
sdn999      up     199178      262939      0
tunnel1965  up     0           9122896     0
- prepend to the metric name: "iface_hw_byte_"
- column 0 will have prometheus label ifc=
- replace all dots "." by "_" . (so interface bundle1.123 will become bundle1_123)
- column 1 defines a metric name "iface_hw_byte_" concatenated to "st" => "iface_hw_byte_st" which is essentially interface status
- if column 1 "state" value is admin/down/up we associate value -1/0/1
- column 2 defines a metric name "iface_hw_byte_" concatenated to "tx" => "iface_hw_byte_tx" which is essentially interface bytes transmitted counter
- column 3 defines a metric name "iface_hw_byte_" concatenated to "rx" => "iface_hw_byte_rx" which is essentially interface bytes received counter
- column 4 defines a metric name "iface_hw_byte_" concatenated to "dr" => "iface_hw_byte_dr" which is essentially interface bytes dropped counter
And if you followed this correctly, we are repeating these lines for software interface counter metric.
Tip
You can view Prometheus configuration for various Grafana dashboard here. Feel free to study these Prometheus configuration and activate them as you see fit depending on your requirements. The set of dashboard is not exhaustive and is by no means absolute. Feel free to submit additional dashboard ! We would gladly add them in the current list of freeRouter Dashboard.
Note
After this definition a freeRouter level you should have:
4 metrics related to hardware counters
- iface_hw_byte_st
- iface_hw_byte_tx
- iface_hw_byte_rx
- iface_hw_byte_dr
4 metrics related to software counters
- iface_sw_byte_st
- iface_sw_byte_tx
- iface_sw_byte_rx
- iface_sw_byte_dr
Which is a total of 8 metrics
Tip
From that point you can check via prometheus console:
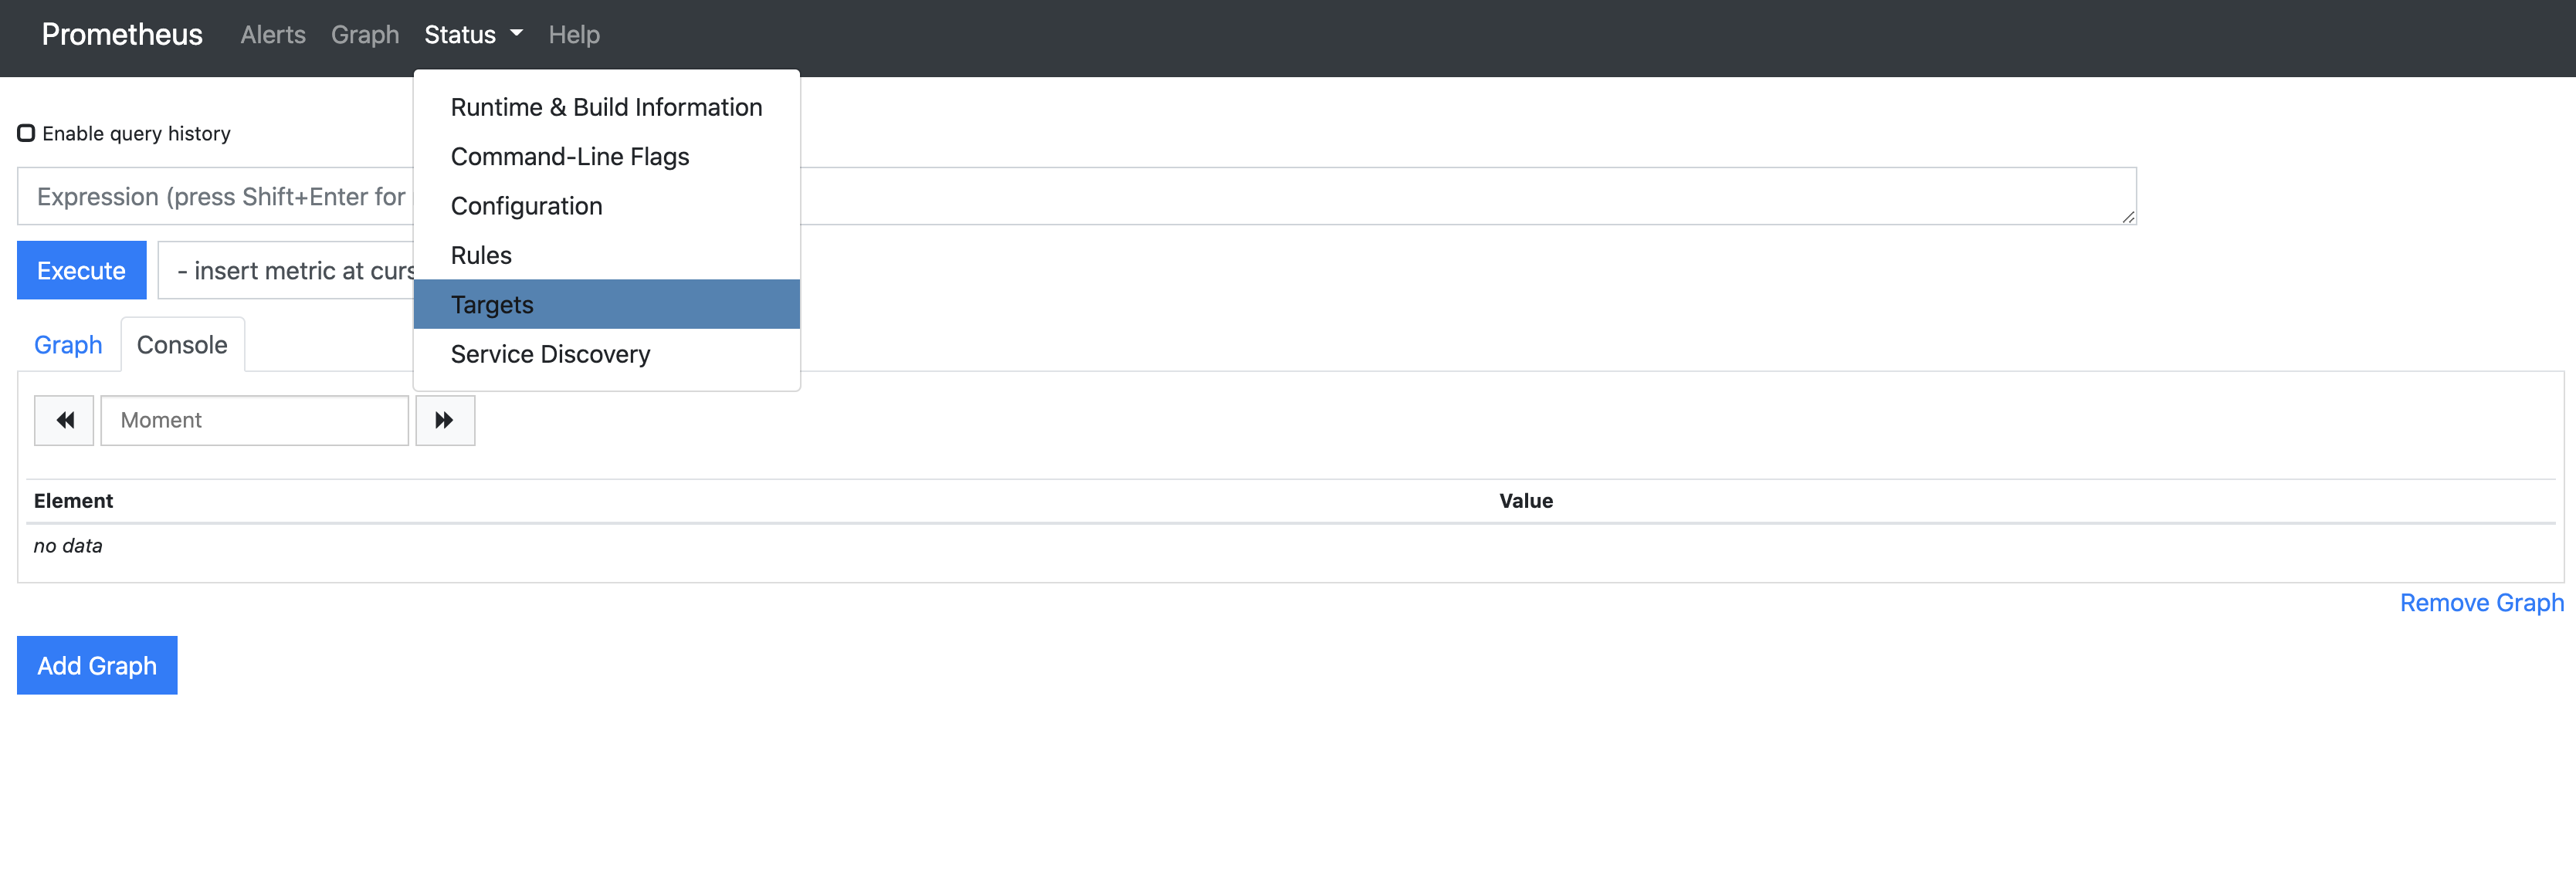
check the "Targets" menu drop down selection
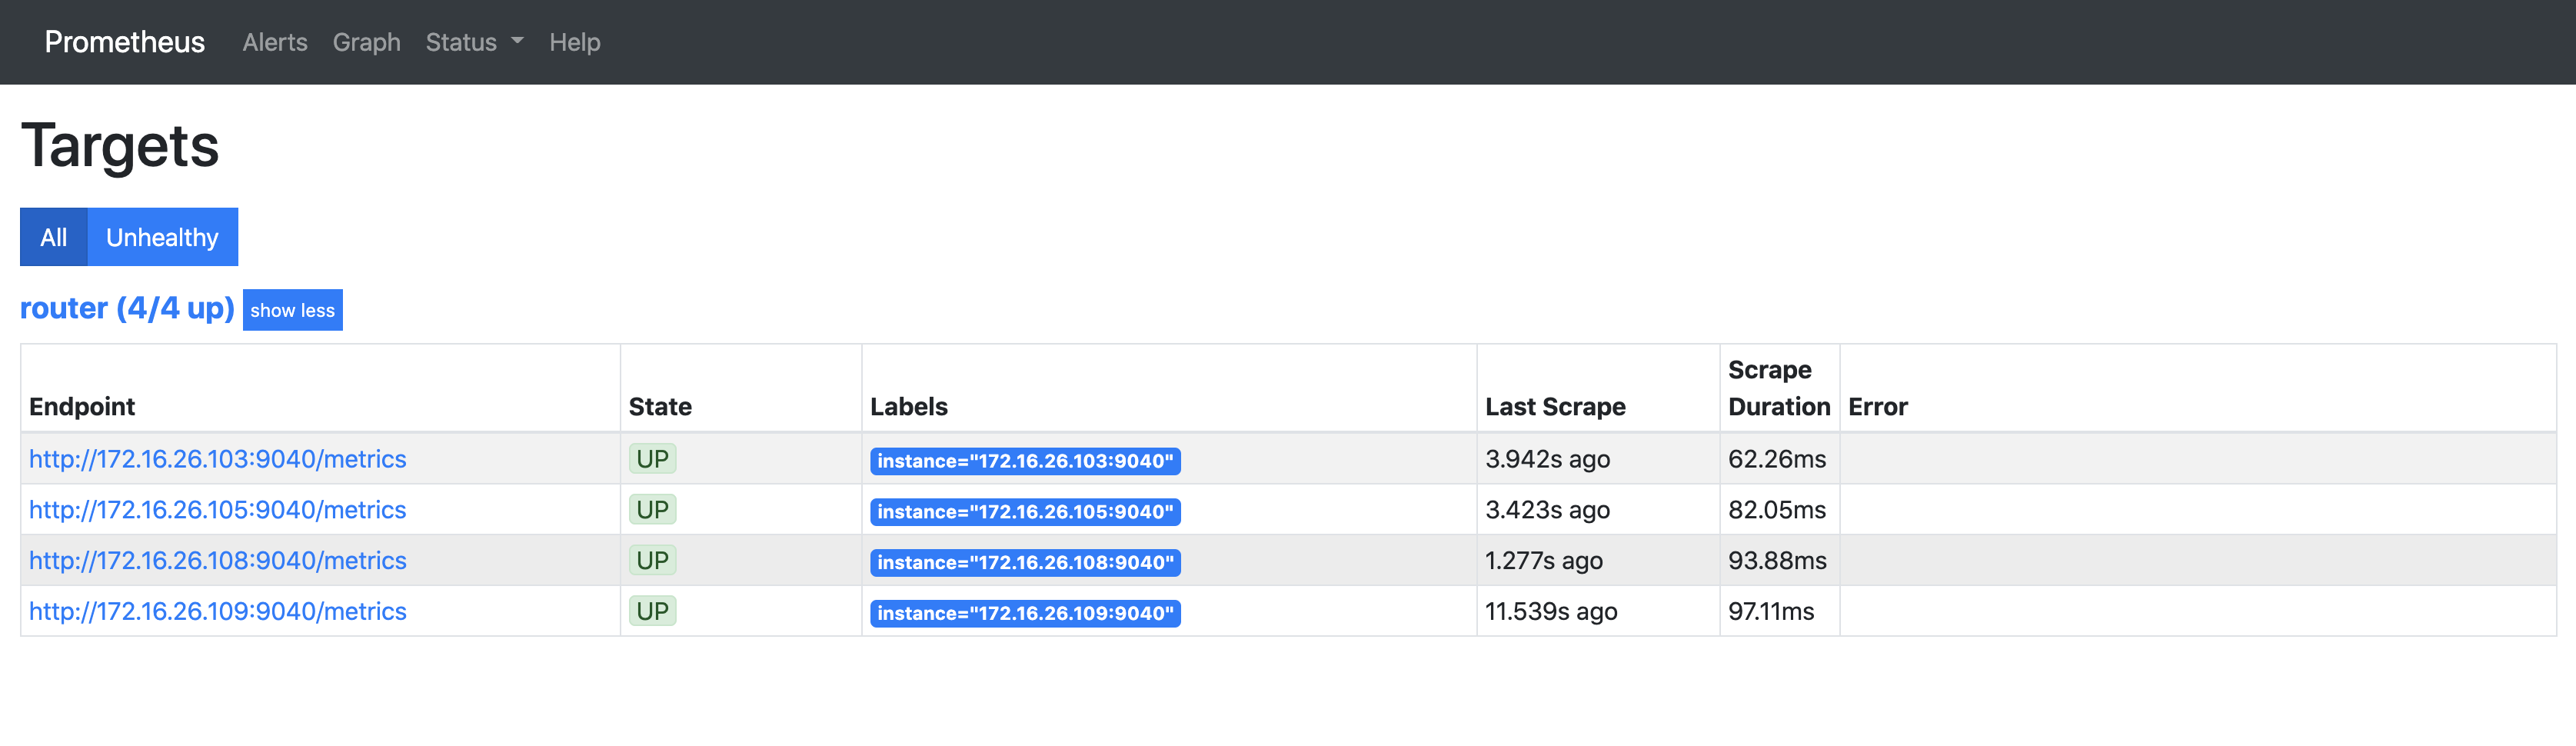
From that point you should be able to use PromQL query filed in order to check that you can retrieve the metrics we defined above.
For metric visualisation, we will use Grafana. Therefore:
- install Grafana from official web site.
- Once installed configure Prometheus as Grafana data source:

- fill in all the prometheus server information

- check the the data source is defined correctly by clicking the "Save & test" button

At that point your Grafana and Prometheus are correctly binded.
- now you need to import "RARE/freeRouter interface bytes" dashboard

- download freeRouter interface bytes dashboard here

- import the dashboard via ID or simply download JSON or use JSON panel

And Voila !
In order to immediately see the graph zoom in to 5m period with a refresh of 5s and you should see automagically the interface bytes TX/RX on all interface for each targets.

Discussion
This example related to interface metrics is universal, as the metrics at freeRouter level are yielded through a generic CLI command:
- "show interface hwsummary"
- or "show interface swsummary".
However some metrics cannot be retrieved by generic interface. Some metrics will be tied to specificities of your network. These can be the AS number, IGP process name, VRF name etc.
Let me give you a couple of example:
Conclusion
In this 1st article, you were presented :
- freeRouter/Prometheus integration
- How to add a new router in the list of Prometheus target
- How to integrate a RARE/freeRouter Grafana Dashboard. (Feel free to adapt the other available dashboard query to your context !)
Final words
In Prometheus philosophy, normally the user should do only the minimum of tweaking regarding configuration. Ultimately, he should be only be able to enable a metric or simply disable it if the scrape cost is too high. However in freeRouter/Prometheus integration process, you see that some metric are issued using specific $variable (VRF, BGP/IGP process number ...) Which makes impossible to maintain this universality. However, from the network operator point of view this should not be a showstopper. On the contrary, it is a powerful choice to be able to alter these command via $variables.
Remember in freeRouter philosophy you can have multiple VRF, multiple IGP and multiple BGP process number ! (Which is not the case for all routing platform)
Last but not least, this Prometheus agent was developed quickly because of one reason, all the objects at the control plane level were already well structured in table form as previously described in this article. So implementing this table row/column logic in order to derive a prometheus metric was technically possible without too much hassle.